10 Best Application Performance Management Software Shortlist
Here's my pick of the 10 best software from the 20 tools reviewed.


With so many different application performance management software available, figuring out which is right for you is tough. You know you want to monitor, manage, and analyze the performance of your software applications but need to figure out which tool is best. I've got you! In this post I'll help make your choice easy, sharing my personal experiences using dozens of different application performance management tools with a variety of teams and projects, with my picks of the best application performance management software.
What is Application Performance Management Software?
Application Performance Management (APM) software is a tool used to monitor, manage, and analyze the performance of software applications. It provides real-time insights into how applications are performing, identifying issues that affect their functionality and user experience. APM software tracks various performance metrics, including response times, server health, and user interactions, to ensure applications are running optimally.
The benefits of APM software include enhanced performance and reliability of applications, leading to improved user satisfaction. By proactively identifying and resolving performance issues, it helps in maintaining consistent service levels. APM tools offer valuable data-driven insights that aid in decision-making for application optimization and resource allocation. They reduce downtime and support costs, contributing to the overall efficiency of IT operations. Additionally, they play a critical role in strategic planning by providing trend analysis for capacity planning and infrastructure improvements.
Overviews Of The 10 Best Application Performance Management Software
Here’s a brief description of each application performance management tool to showcase each one’s best use case, noteworthy features, screenshots, and pricing information.

New Relic is a robust and comprehensive observability tool that can help you monitor and debug multiple aspects of your stack.
Why I picked New Relic: This software centralizes your security, issues, and bug tracking in one place, helping you keep an eye across all your tools and data sources. You get a complete overview of health insights at every stage of development, and every part of your stack. Its performance tracking capabilities help you spot and diagnose errors and issues swiftly. The platform's AI assistant, 'Grok', can read your telemetry and identify any notable outliers for you. You can ask it questions, and it can not just help you determine a root cause for an issue but also provide you with potential code changes.
New Relic Standout Features & Integrations
Key features include the software's newly-implemented interactive application security testing (IAST) capabilities. The tool helps you spot and fix high-risk errors and vulnerabilities during the development process. By using the tool, you can troubleshoot issues in your code more quickly and ship more secure, well-tested products.
Integrations include over 500 apps including AWS, Google Cloud, Microsoft Azure, Jenkins, CircleCI, Travis CI, and Slack. It also has an API you can use to build custom integrations.
Pros and cons
Pros:
- AI-powered anomaly detection and intelligent alerting
- Wide range of monitoring capabilities
- Integrates seamlessly with popular dev tools
Cons:
- Has a bit of a learning curve
- Added complexity from reliance on agents installed on application servers

Lumigo is a company that specializes in cloud-native monitoring and observability solutions, specifically designed for applications and services hosted on Amazon Web Services (AWS). Lumigo provides tools and services that help organizations monitor, troubleshoot, and optimize their serverless and microservices applications on AWS.
Why I Picked Lumigo: Lumigo excels as an application performance management software by offering comprehensive observability solutions tailored to serverless and microservices architectures on AWS. It stands out with its ability to provide distributed tracing, error tracking, and performance monitoring, helping organizations quickly pinpoint and resolve issues within their cloud-native applications. With real-time alerts, seamless integration with AWS services, and a focus on cost optimization, Lumigo empowers businesses to ensure the reliability, efficiency, and cost-effectiveness of their serverless and microservices deployments, ultimately enhancing the overall performance and user experience of their applications.
Lumigo Standout Features & Integrations
Key features include automated distributed tracing feature goes beyond traditional manual instrumentation. It automatically traces and visualizes the flow of requests and events across AWS services, eliminating the need for developers to add custom code for tracing. This automation streamlines the observability process and reduces the burden on development teams, making it easier to gain insights into complex, serverless architectures.
Integrations include AWS, Gmail, Outlook, Slack, PagerDuty, Microsoft Teams, VictorOps, and OpsGenie.
Pros and cons
Pros:
- Specialization in AWS serverless
- Provides cost optimization insights
- Free for 150K traces and unlimited users
Cons:
- Some learning curve for users
- Primary focus on AWS may be a limitation for some

Tricentis NeoLoad is a performance testing platform designed to address the complexities of modern application testing, offering capabilities for testing APIs, microservices, and end-to-end application performance.
Why I picked Tricentis NeoLoad: I selected Tricentis NeoLoad for application performance management software due to its robust performance testing capabilities and its scalability, which is critical for managing large and complex systems. What differentiates it is its suite of advanced features, including RealBrowser performance testing and seamless integration with CI/CD pipelines, which cater to the needs of modern enterprises.
Tricentis NeoLoad Standout Features & Integrations
Key features include load testing to evaluate application performance under different user loads, and stress testing to determine stability under extreme conditions. It supports a broad range of technologies and protocols, which ensures compatibility with diverse applications.
Its scalability is also a key feature, enabling businesses to efficiently conduct performance load testing across a range of environments and technologies, which positions it as a suitable choice for scalable performance testing requirements.
Integrations include Dynatrace, Worksoft Certify, Tricentis Tosca, Jenkins, qTest, DataExchangeApi, SAP Solution Manager, and JIRA.
Pros and cons
Pros:
- Excellent customer support
- Codeless and dynamic value capture
- Low licensing cost
Cons:
- Integration with third-party tools can be complicated
- Support for more protocols needed

Gatling is a high-performance application performance management software designed for load testing and stress testing. With its powerful scripting capabilities and real-time monitoring features, Gatling allows users to simulate thousands of concurrent users, measure performance metrics, and identify performance bottlenecks, helping organizations ensure the scalability and reliability of their applications.
Why I Picked Gatling: Gatling is a powerful performance testing tool that excels in various areas, including scenario recording. With Gatling, testers can easily record user interactions and generate test scenarios by using the built-in recorder. The scenario recording feature captures HTTP requests and responses, along with user actions, allowing testers to create realistic test scripts without the need for manual scripting. It enables the conversion of user interactions into executable Gatling scripts, saving time and effort in test script creation. Gatling's scenario recording feature provides flexibility, allowing testers to customize and modify the generated scripts as needed, ensuring accurate simulation of user behavior and realistic load testing scenarios.
Gatling Standout Features & Integrations
Key features include built-in support for handling asynchronous requests, such as long polling and web sockets, allowing testers to accurately simulate real-world scenarios where multiple concurrent asynchronous requests are being processed. Gatling also boasts a powerful simulation engine that allows testers to define complex and realistic user scenarios. Its DSL (domain-specific language) provides a concise and expressive syntax for describing user behavior, allowing testers to create sophisticated test scenarios easily.
Integrations include Github Actions, Gitlab CI, Jenkins, Teamcity, and Bamboo. You can build additional connections using the Gatling API.
Pros and cons
Pros:
- Open source & free to use
- Low resource footprint
- Flexible scala-based DSL
Cons:
- Smaller ecosystem of integrations
- Limited protocol support

Riverbed SteelCentral AppResponse is a robust application performance management software that provides end-to-end visibility and analysis of application performance. With its advanced network monitoring, deep packet inspection, and real-time analytics, AppResponse allows organizations to detect performance issues, troubleshoot network problems, and optimize application performance for enhanced user satisfaction and productivity.
Why I Picked Riverbed SteelCentral AppResponse: Riverbed SteelCentral AppResponse is a highly effective application performance management software that excels in providing deep packet inspection capabilities. AppResponse leverages its deep packet inspection technology to capture, analyze, and decode network traffic at the packet level. This allows for comprehensive visibility into application transactions, network interactions, and the performance of individual components within the network infrastructure. By examining packet-level details, AppResponse can identify latency issues, network bottlenecks, and protocol anomalies that may impact application performance. This deep level of insight enables organizations to pinpoint the root causes of performance degradation.
Riverbed SteelCentral AppResponse Standout Features & Integrations
Key features include end-to-end visibility into the entire application delivery chain, including the network, infrastructure, and application layers. This holistic view allows organizations to understand the performance impact at each stage and identify bottlenecks across the entire application ecosystem. Additionally, AppResponse seamlessly integrates with other Riverbed products, such as SteelCentral NetProfiler and SteelCentral AppInternals, creating a powerful and interconnected application performance management ecosystem.
Integrations are possible via the NetProfiler RESTful API. Additional integrations are possible with Sensor, Flow Gateway, NetShark, and AppResponse, SteelHead SteelFlow Net, NetFlow, sFlow, compatible Packeteer PacketShapers, Nessus, Rapid7, nCircle, Qualys, Foundscan, Microsoft Active Directory, and a dozens of other platforms and services in the testing and monitoring sphere.
Pros and cons
Pros:
- Access to other Riverbed tools for increased functionality
- Deep packet inspection capabilities
- End-to-end transaction visibility
Cons:
- SMBs may be priced out
- Resourctensive (hardware, processine-ing power)

Apache Benchmark, also known as ab, is a lightweight and command-line based application performance management software. It is specifically designed for quick and straightforward load testing, allowing users to send a high volume of concurrent requests to a web server and measure its performance and response times, making it a popular choice for simple performance testing scenarios.
Why I Picked Apache Benchmark: Apache Benchmark (ab) is a command-line tool developed by the Apache Software Foundation that is widely used for performance benchmarking of web servers and applications. It works well for application performance management software due to its simplicity and effectiveness in measuring the performance of a system under different loads. By simulating multiple concurrent requests, ab generates a significant amount of traffic and measures various performance metrics like requests per second, latency, and throughput. This allows developers and system administrators to evaluate the scalability and efficiency of their applications, identify bottlenecks, and make informed decisions for optimizing and fine-tuning their software to deliver optimal performance.
Apache Benchmark Standout Features & Integrations
Key features include a wide array of customizable options, allowing users to tailor their benchmarking tests to specific requirements. Users can define the number of requests, concurrency levels, and even customize HTTP headers, enabling them to simulate real-world scenarios and fine-tune their performance tests to match their unique application environments. This flexibility makes Apache Benchmark a versatile tool that can adapt to a variety of performance benchmarking needs.
Integrations can be built from scratch using the Apache Benchmark open source framework.
Pros and cons
Pros:
- Free to use
- Integration with Apache ecosystem
- Lightweight & efficient
Cons:
- Single-purpose tool (load testing HTTP servers)
- Limited features & flexibility

BMC TrueSight is an application performance management software that provides comprehensive monitoring and analysis capabilities for complex IT environments. With its advanced analytics, proactive alerting, and deep visibility into applications and infrastructure, TrueSight empowers organizations to optimize application performance, ensure high availability, and deliver superior user experiences.
Why I Picked BMC TrueSight: BMC TrueSight stands out in application performance management software with its strong focus on root cause analysis. TrueSight employs advanced analytics and machine learning algorithms to analyze the vast amount of data collected from various sources, including infrastructure, applications, and user interactions. By correlating and contextualizing this data, TrueSight can identify patterns, anomalies, and potential causes of performance issues. It goes beyond surface-level metrics to delve into the underlying factors impacting application performance. TrueSight's ability to pinpoint the root cause of performance problems enables faster troubleshooting and resolution, minimizing downtime and optimizing application performance.
BMC TrueSight Standout Features & Integrations
Key features include a holistic, multi-domain visibility by collecting and correlating data from diverse sources, including applications, infrastructure, and user experience. This comprehensive view allows organizations to understand the entire application stack and identify performance issues across various layers and components. TrueSight also excels in automation with its intelligent automation capabilities. It leverages machine learning and artificial intelligence to automate routine tasks, such as event correlation, impact analysis, and remediation actions.
Integrations include many Amazon and AWS products and services, all MIcrosoft Azure products, Google Virtual Machine, Google App Engine, Pivotal Cloud Foundry, Docker, Kubernetes, Kafka, Oracle Weblogic, SAP platforms, and other popular testing, monitoring, and database solutions.
Pros and cons
Pros:
- Robust root cause analysis
- Enterprise-grade capabilities
- Comprehensive integration & automation
Cons:
- Yearly maintenance fees
- Complexity & learning curve
Best for monitoring Google Cloud Platform services & infrastructure

Google Cloud Monitoring is a comprehensive application performance management software that provides robust monitoring and observability capabilities for applications running on the Google Cloud Platform. With its scalable architecture, real-time metrics, and powerful dashboards, Google Cloud Monitoring enables users to track performance, detect anomalies, and optimize application performance, ensuring reliable and efficient operations in the cloud environment.
Why I Picked Google Cloud Monitoring: Google Cloud Monitoring is an excellent application performance management software that excels in monitoring Google Cloud Platform (GCP) services and infrastructure. With deep integration into GCP, Google Cloud Monitoring provides comprehensive visibility into the performance and health of GCP resources, including virtual machines, databases, storage, networking, and more. It offers a wide range of pre-configured metrics and dashboards specifically designed for GCP services, enabling users to monitor key performance indicators and track service-level objectives. Google Cloud Monitoring provides real-time alerts, anomaly detection, and powerful data visualization, allowing users to proactively identify and respond to performance issues. Its seamless integration with other Google Cloud services, such as Stackdriver Logging and Error Reporting, further enhances the monitoring capabilities for GCP applications and infrastructure.
Google Cloud Monitoring Standout Features & Integrations
Key features include a vast ecosystem of integrations with other Google Cloud services, including Stackdriver Logging, Error Reporting, and Trace, enabling seamless data correlation and analysis across various components of the application stack. Additionally, Google Cloud Monitoring leverages advanced machine learning algorithms to automatically detect anomalies, predict future trends, and provide intelligent insights into application performance. This powerful machine learning functionality enables proactive monitoring, efficient root cause analysis, and smart alerting.
Integrations include Apache Web Server, Apache ActiveMQ, Apache Airflow, Apache Cassandra, Apache CouchDB, MySQL, Redis, Kubernetes Engine, Active Directory Domain Services, Aerospike, and many others.
Pros and cons
Pros:
- Access to other Google Cloud services increases functionality
- Customizable dashboards & alerts
- Integration with other monitoring tools
Cons:
- Complexity for non-GCP environments
- Learning curve for advanced features

Microsoft Azure Application Insights is a powerful application performance management software designed for monitoring and analyzing the performance of applications hosted on the Azure platform. With its deep insights, automatic instrumentation, and integration with Azure services, Application Insights enables developers to identify performance bottlenecks, track user behavior, and gain valuable insights to optimize application performance and deliver exceptional user experiences.
Why I Picked Microsoft Azure Application Insights: Microsoft Azure Application Insights is a robust application performance management software that excels in providing end-to-end application monitoring capabilities. Application Insights offers deep visibility into the entire application stack, including the front-end, back-end, and dependencies. It collects and analyzes performance metrics, logs, and telemetry data from various sources, allowing users to track and monitor every aspect of their application's performance. With its powerful monitoring and diagnostics features, Application Insights enables real-time tracking of application health, response times, and availability. It also provides detailed insights into exceptions, dependencies, and performance bottlenecks, allowing developers and operations teams to proactively identify and address issues.
Microsoft Azure Application Insights Standout Features & Integrations
Key features include seamless integration with other Azure services, allowing users to leverage the full potential of the Azure ecosystem. This integration enables enhanced monitoring and diagnostics, as well as the ability to correlate application performance data with other Azure resources, such as virtual machines, databases, and containers. Application Insights also provides powerful analytics capabilities, leveraging machine learning algorithms to analyze vast amounts of telemetry data and provide actionable insights.
Integrations include AIMS AIOps, Alert Logic Log Manager, AppDynamics APM, Atlassian JIRA, BMC Helix, Botmetric, Circonus, CloudHealth, CloudMonix, Datadog, Dynatrace, Elastic, Grafana, InfluxData, LogicMonitor, LogRhythm, Logz.io, and hundreds of other options. Being a popular and well-known tool, most related software will connect in some way to Azure Application Insights.
Pros and cons
Pros:
- Access to other Azure services increase functionality
- End-to-end application monitoring
- Auto-instrumentation, ease of use
Cons:
- Free credits expire after 30 days
- Limited support for non-Azure environments

SolarWinds AppOptics is an application performance management software that offers robust monitoring and troubleshooting capabilities. With its distributed tracing, real-time analytics, and customizable dashboards, AppOptics allows users to gain deep visibility into their applications, identify performance bottlenecks, and optimize application performance for enhanced user experience.
Why I Picked SolarWinds AppOptics: SolarWinds AppOptics is a robust application performance management software that excels in transaction tracing, enhancing the overall management of application performance. AppOptics provides comprehensive transaction tracing capabilities by capturing detailed information about individual transactions as they flow through the application stack. By instrumenting the code and capturing transaction-specific data, such as method calls, database queries, and external service interactions, AppOptics enables developers and operators to visualize and analyze the complete transaction path. This allows for in-depth performance monitoring, identification of bottlenecks, and root cause analysis of issues. AppOptics' transaction tracing feature provides valuable insights into transaction behavior, latency, and dependencies.
SolarWinds AppOptics Standout Features & Integrations
Key features include distributed tracing, allowing users to trace transactions across complex, distributed systems. This feature enables users to understand the performance of their applications across various services, microservices, and APIs, providing a holistic view of the entire system. AppOptics also integrates seamlessly with other SolarWinds monitoring solutions, such as Loggly and Papertrail. This integration allows users to correlate performance metrics with logs and traces, enabling comprehensive analysis and troubleshooting.
Integrations include AWS, Azure, Heroku, Loggly, Papertrail, Apache, Cassandra, Docker, MongoDB, Microsoft SQL Server, MySQL, Kubernetes, Oracle, Tomcat, Varnish, ZooKeeper, and many others.
Pros and cons
Pros:
- Comprehensive infrastructure monitoring
- Access to other SolarWinds tools for increased functionality
Cons:
- Min. buy of 10+ hosts/month
- Complexity for small teams
The Best Application Performance Management Software Summary
| Tools | Price | |
|---|---|---|
| New Relic | From $49/user/month | Website |
| Lumigo | $99/month (paid annually) | Website |
| Tricentis NeoLoad | From $20,000/year for up to 300 virtual users | Website |
| Gatling | Free To Use | Website |
| Riverbed SteelCentral AppResponse | From $60,000/year | Website |
| Apache Benchmark (ab) | Free To Use | Website |
| BMC TrueSight | From $80/license + maintenance fees | Website |
| Google Cloud Monitoring | From $0.50/GB | Website |
| Microsoft Azure Application Insights | From $0.615/GB | Website |
| SolarWinds AppOptics | From $99.90/month (10 hosts, 100 containers) | Website |
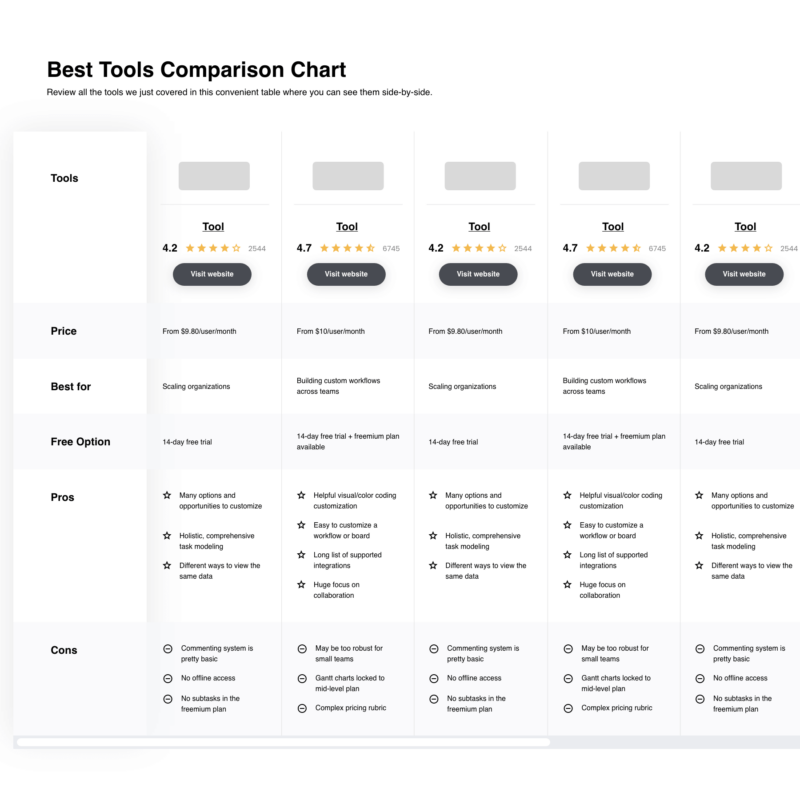
Compare Software Specs Side by Side
Use our comparison chart to review and evaluate software specs side-by-side.
Compare SoftwareOther Performance Testing Options
Here are a few more options that didn’t make the best application performance management software list:
- IBM Cloud APM
Best for enterprise-grade capabilities & scalability
- Datadog APM
Best for test collaboration
- Stackify Retrace
Best for code-level insights
- Apache JMeter
Best for broad protocol support
- Splunk
Best for log monitoring & analysis
- Sentry
Best for detailed issue reports
- ManageEngine Applications Manager
Best for visualizing application service maps
- AppDynamics
Best for application dependency monitoring
- Scout APM
Best customer support
- Instana
Best for Service level management


Selection Criteria for Application Performance Management Software
Perhaps you're wondering how I selected the best application performance management software for this list. To build this top 10 list, I evaluated and compared a wide range of application performance management software with positive user ratings. After determining a long list of top choices, I further honed down the list by using the selection criteria below to see how each platform stacked up against the next one. I also drew on my years of QA experience to pinpoint the features that add significant user value.
Here’s a short summary of the main selection and evaluation criteria I used to develop my list of the best application performance management software for this article.
Core Functionality
APM software typically includes various features and capabilities to monitor and optimize the performance of applications. While the specific functionalities may vary depending on the software provider and the needs of the application, here are the core functions that must be covered to be considered for inclusion on this list.
- Provide comprehensive monitoring of the application's performance, including tracking various metrics such as response time, latency, throughput, error rates, CPU and memory utilization, network traffic, and database performance.
- Offer diagnostic capabilities to troubleshoot and analyze the root causes of performance problems, providing detailed insights into the application's internal behavior, code execution, and dependencies.
Key Features
Application performance management (APM) software typically offers a range of features to monitor, analyze, and optimize the performance of applications. While the specific feature set may vary across different APM solutions, some key features commonly found in APM software include:
- Application Monitoring: Real-time monitoring of application performance metrics such as response time, latency, throughput, error rates, CPU and memory utilization, network traffic, and database performance. This feature enables administrators to track the overall health and performance of the application.
- Real User Monitoring: The ability to track and monitor real users as they interact with your application, looking for pain points, errors, conversion drops, or UI frustrations. Real world data is critical to understanding your target users, what they need, and what issues they face.
- Transaction Tracing: The ability to trace and analyze individual transactions or requests as they traverse through the various components and layers of the application stack. Transaction tracing helps identify performance bottlenecks and understand the flow of execution, making it easier to pinpoint issues and optimize performance.
- Code-level Diagnostics: APM software often provides visibility into the application's code execution, allowing developers to identify performance issues at the code level. This may include features like code profiling, which measures the execution time of different code segments, and identifies hotspots or areas of inefficiency.
- Error and Exception Monitoring: The capability to capture and analyze application errors, exceptions, and log messages. This helps in identifying and resolving issues that impact the application's stability and performance.
- User Experience Monitoring: Monitoring and tracking user interactions and experiences with the application. This includes metrics such as page load times, user session information, click paths, and conversion rates. User experience monitoring helps identify performance issues from the user's perspective and optimize the application's usability.
- Database Monitoring: Monitoring and analysis of database performance metrics such as query execution time, database response times, and resource utilization. This feature helps identify and optimize database-related performance bottlenecks.
- Alerting and Notification: The ability to configure custom alerts and notifications based on predefined thresholds or conditions. This ensures that administrators and developers are promptly notified of any performance degradation or anomalies in the application's behavior.
- Reporting and Analytics: APM software often provides reporting capabilities to generate performance reports, trend analysis, and insights into application performance over time. Advanced analytics features may include anomaly detection, root cause analysis, and predictive analysis.
- Scalability and Distributed Architecture: APM solutions should be capable of monitoring and managing applications deployed in complex, distributed environments such as microservices architectures or cloud-based deployments. This includes support for scalability, auto-discovery of application components, and the ability to handle large volumes of monitoring data.
Usability
Usability is crucial when selecting APM software because it determines how effectively and efficiently users can leverage the tool's features and functionality. A user-friendly interface and intuitive navigation make it easier for administrators, developers, and other stakeholders to monitor and analyze application performance without extensive training or technical expertise. For example, a clear dashboard with visualizations and easy-to-understand metrics allows users to quickly identify performance issues and take appropriate action. I also consider compatibility with multiple programming and scripting languages (Python, Java, Ruby, PHP) to be a usability win.
Software Integrations
Software integrations are vital when selecting APM software because they allow seamless connectivity with other tools and systems within the application ecosystem. Integrations enable organizations to gather comprehensive data from various sources, providing a holistic view of application performance. For instance, integrating APM software with popular logging platforms like Splunk or ELK allows correlation of performance metrics with detailed log data, facilitating efficient troubleshooting and root cause analysis. Integration with collaboration tools like Slack or Jira enables streamlined communication and issue tracking between teams, enhancing collaboration and problem resolution. Furthermore, integrations with cloud platforms like AWS or Azure enable monitoring of application performance in dynamic and scalable cloud environments.
Automations
Automations are crucial when selecting APM software because they streamline processes, reduce manual effort, and enable proactive management of application performance. Automated tasks and workflows help save time and resources while ensuring continuous monitoring and optimization. For example, automated alerting can notify administrators or developers instantly when performance thresholds are breached, enabling prompt action. Automated baselining and anomaly detection can identify performance deviations automatically, reducing the need for manual monitoring. Additionally, automated scaling and provisioning of resources based on performance metrics ensure efficient resource allocation in dynamic environments, such as cloud-based applications.
People Also Ask
Here are a few important questions to cover when thinking about APM software.
How much does APM software cost?
The cost of APM software can vary significantly depending on various factors such as the vendor, the specific features included, the size and complexity of the application environment, and the level of support required. Generally, APM software can range from a few thousand dollars per year for small-scale deployments to hundreds of thousands or even millions of dollars per year for enterprise-level solutions. Some entry-level or basic APM offerings may start at around $5,000 to $10,000 per year, while more comprehensive and feature-rich solutions can cost upwards of $100,000 per year. Additionally, additional costs may be incurred for customization, integration, training, and ongoing support services. It is advisable to contact APM vendors directly for accurate and detailed pricing information tailored to specific requirements.
What is APM in SAAS?
APM in SaaS (Software-as-a-Service) refers to Application Performance Management solutions that are delivered and accessed through the SaaS model. In this context, APM software is provided as a cloud-based service, eliminating the need for organizations to install and maintain on-premises infrastructure or software. Instead, users can access the APM solution through a web browser or dedicated application.
APM in SaaS allows businesses to leverage the benefits of APM without the upfront costs and complexities associated with deploying and managing the software on their own infrastructure. It offers scalability, flexibility, and ease of use, making it suitable for organizations of various sizes and industries. Users typically pay a subscription fee based on factors such as the number of monitored applications, the volume of data collected, and the level of features and support provided by the SaaS APM vendor.
What is an example of application performance management?
One example of how application performance management (APM) can be used and how it can help is in the context of an ecommerce website. Let’s consider an online retail platform that experiences slow response times and high error rates during peak shopping periods.
Using APM, the operations team can monitor the application’s performance in real-time and identify the specific components or areas causing the performance degradation. They can analyze transaction traces to pinpoint bottlenecks, such as slow database queries or inefficient code segments. By diagnosing and addressing these issues, they can improve the application’s response time and stability.
APM can provide insights into user experience by monitoring metrics like page load times, click paths, and conversion rates. By analyzing this data, the development and UX teams can optimize the website’s performance, enhance the user journey, and increase conversion rates.
APM can proactively detect anomalies or unusual patterns in application behavior, allowing the operations team to investigate and resolve potential issues before they impact users. Customized alerts and notifications can be set up to notify the team of performance deviations, enabling them to take immediate action.
APM helps businesses ensure that their applications perform optimally, providing a seamless user experience, improving customer satisfaction, and maximizing revenue generation during critical periods such as online sales events.
What are the benefits of APM software?
APM software offers several benefits for organizations aiming to optimize the performance of their applications. Some key benefits of APM software include:
- Enhanced Application Performance: APM software provides real-time monitoring and diagnostics, allowing organizations to identify and resolve performance bottlenecks promptly. By gaining insights into the application’s behavior, code execution, and dependencies, businesses can optimize performance, reduce response times, and improve the overall user experience.
- Improved User Experience: APM software helps organizations understand how users interact with their applications, monitoring metrics such as page load times, click paths, and conversion rates. By analyzing this data, businesses can identify areas of improvement, optimize workflows, and enhance the user journey, leading to increased user satisfaction and engagement.
- Faster Problem Resolution: APM software offers comprehensive diagnostic capabilities, enabling organizations to quickly identify the root causes of performance issues. With transaction tracing, code profiling, error analysis, and log monitoring, businesses can efficiently troubleshoot problems, saving time and resources that would otherwise be spent on manual investigation and trial-and-error debugging.
- Proactive Issue Detection: APM software includes alerting and anomaly detection mechanisms to notify administrators and developers about potential performance deviations or abnormalities. This proactive approach allows organizations to address issues before they escalate, minimizing downtime, and preventing significant business impact.
- Efficient Resource Utilization:
APM software provides visibility into resource usage, including CPU, memory, and database utilization. By identifying inefficiencies and optimizing resource allocation, organizations can make better use of their infrastructure, reduce costs, and scale their applications effectively. - Capacity Planning and Scalability:
APM software helps organizations anticipate future needs by providing data on application performance, usage patterns, and growth trends. This information enables capacity planning and ensures that resources are allocated adequately to meet demand, avoiding over-provisioning or underutilization of infrastructure. - Enhanced Collaboration:
APM software fosters collaboration between different teams, such as developers, operations, and business stakeholders. By providing a unified view of application performance data, APM software facilitates communication, enables faster problem resolution, and aligns teams towards a common goal of delivering high-performance applications. - Data-Driven Decision Making:
APM software collects and analyzes vast amounts of performance data, allowing organizations to make informed decisions based on quantitative insights. This data-driven approach helps prioritize optimization efforts, allocate resources effectively, and align application performance with business objectives.
APM software empowers organizations to optimize their applications, improve user satisfaction, ensure efficient resource utilization, and enable faster problem resolution, leading to increased productivity, cost savings, and better business outcomes.
Other Application Testing Reviews
If you’re looking for APM software, you might also benefit from checking out these other articles:
- Performance Testing Software
- Web Application Testing
- Mobile Application Testing Tools
- Web Application Penetration Testing Tools
- Static Application Security Testing Tools (SAST)
The Takeaway
Selecting the best application performance monitoring tools is a critical decision for organizations aiming to optimize their application performance with the end-user experience in mind. Through our comprehensive comparison and review of top APM solutions, it is evident that each software offers unique features and strengths to address specific needs.
Sign up to the QA Lead newsletter for weekly insights on testing strategy, team management, and software and service reviews.
Related Read: Leadership In Test: Managing Performance Testing