10 Best Synthetic Monitoring Tools Shortlist
Here's my pick of the 10 best software from the 20 tools reviewed.


With so many different synthetic monitoring tools available, figuring out which is right for you is tough. You know you want to simulate user interactions with websites and applications to monitor their performance and availability but need to figure out which tool is best. I've got you! In this post I'll help make your choice easy, sharing my personal experiences using dozens of different synthetic monitoring software with a variety of teams and projects, with my picks of the best synthetic monitoring tools.
What Are Synthetic Monitoring Tools?
Synthetic monitoring tools are software designed to simulate user interactions with websites, applications, or services. These tools create and execute scripted actions and paths that mimic real user behavior, such as clicking links, filling out forms, or navigating through a website. The primary function of synthetic monitoring is to continuously test and monitor the performance and functionality of web services, ensuring their availability and responsiveness.
These tools are particularly useful for identifying and diagnosing issues related to website or application performance, availability, and user experience. By using scripted interactions, synthetic monitoring can provide consistent and continuous insights into how a system performs, regardless of actual user traffic. This approach is valuable for testing new features, assessing performance under different conditions, and ensuring that critical functionalities of web services are always operational and delivering an optimal user experience.
Overviews Of The 10 Best Synthetic Monitoring Tools
Here’s a brief description of each synthetic monitoring tool that showcases each software’s best use case, outstanding features, and some pros and cons. I’ve also included screenshots to give you a snapshot of their user interface too.
Best for comprehensive app monitoring

ManageEngine Applications Manager is a comprehensive application performance management solution designed to ensure optimal performance and availability of applications and servers.
Why I picked ManageEngine Applications Manager: ManageEngine Applications Manager employs machine learning algorithms to detect anomalies in application and server performance automatically. This feature allows it to learn from historical performance data and identify deviations that could indicate potential issues before they impact service levels. This proactive monitoring helps in preempting problems, which is not as extensively featured in many other similar tools.
ManageEngine Applications Manager Standout Features and Integrations
Key features include real-time monitoring of application performance, in-depth troubleshooting capabilities, automated anomaly detection, and root cause analysis. It supports a wide range of applications, databases, servers, and cloud services, offering detailed insights through intuitive dashboards. Additionally, it provides robust reporting tools, configurable alerts, and the ability to automate corrective actions, enhancing the efficiency of IT operations and ensuring continuous service delivery. This tool is particularly useful for IT administrators and operations teams looking to maintain high service levels in complex IT environments.
ManageEngine Applications Manager natively integrates with several software tools, including Amazon Web Services (AWS), Microsoft Azure, VMware, Microsoft SQL Server, Oracle Database, MySQL, SAP, IBM Db2, Redis, and Docker. These integrations facilitate comprehensive monitoring and management of various IT services and infrastructure
Pros and cons
Pros:
- Flexibility to create and monitor custom scripts is a significant advantage
- Provides detailed performance metrics and powerful diagnostic capabilities
- Supports a wide range of applications, servers, databases, and cloud services
Cons:
- While feature-rich, the user interface can be overwhelming for new users
- Initial setup and configuration of the tool can be complex
Best for monitoring HTTP/HTTPS URLs, web sockets, and ICMP Ping
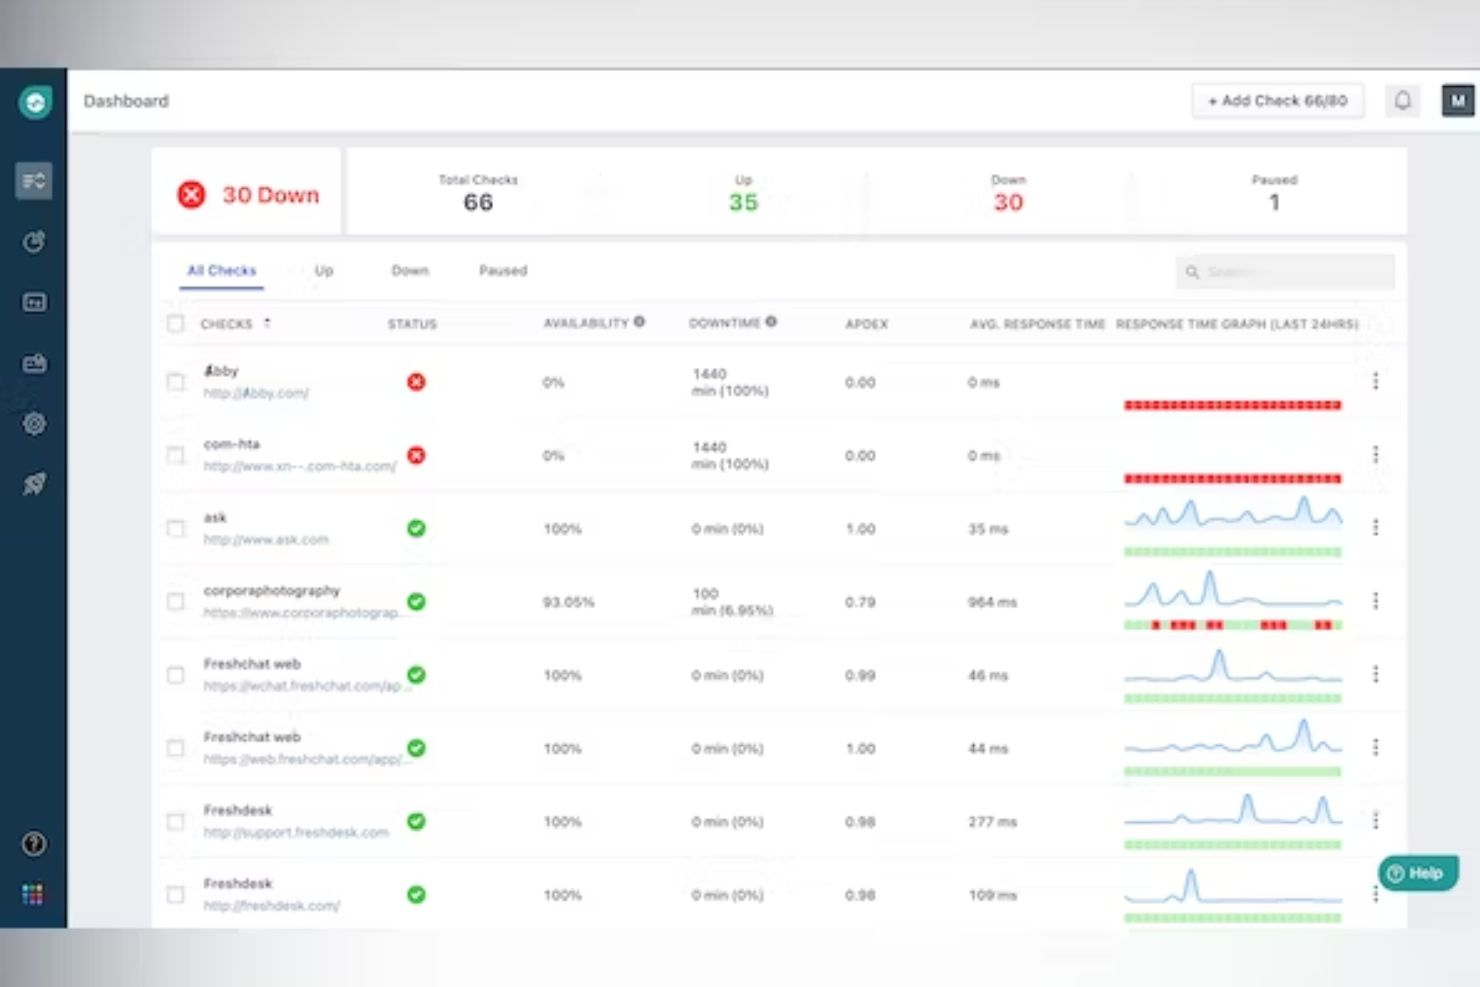
Freshping is a free website monitoring software. It provides detailed monitoring reports that help you make sense of website downtimes or performance issues at a glance.
Why I picked Freshping: It’s free and capable of helping you monitor HTTP/HTTPS URLs, web sockets, ICMP Ping, TCP, UDP, and DNS from 10 locations globally. With this tool, you enjoy the flexibility of receiving alerts through the channels that work for your team. You can configure Webhooks to build a customized notification channel that your team works with or that suits your business.
Freshping Standout Features and Integrations
Standout features: Freshping provides detailed incident history and outage analysis reports. You don’t just get notified when changes happen, you also get to know where the performance issues lie and what exactly happened. This platform features status pages, which help you keep your customers informed about uptime and incidents. You can customize the status pages as you wish and display your website’s uptime history by embedding real-time Status Badges on a webpage.
Integrations include Freshdesk, Freshservice, Slack, Webhooks, Twilio, Freshstatus, Instatus, LeadMaster, Squadcast, Lightstep, and Zapier.
Pros and cons
Pros:
- Helps you control false positives
- Customizable alerting system
- It’s available for free
Cons:
- Some integrations are difficult to set up
- Customer support needs to be more responsive
Pingdom
Best synthetic monitoring tool for testing your website’s availability across countries
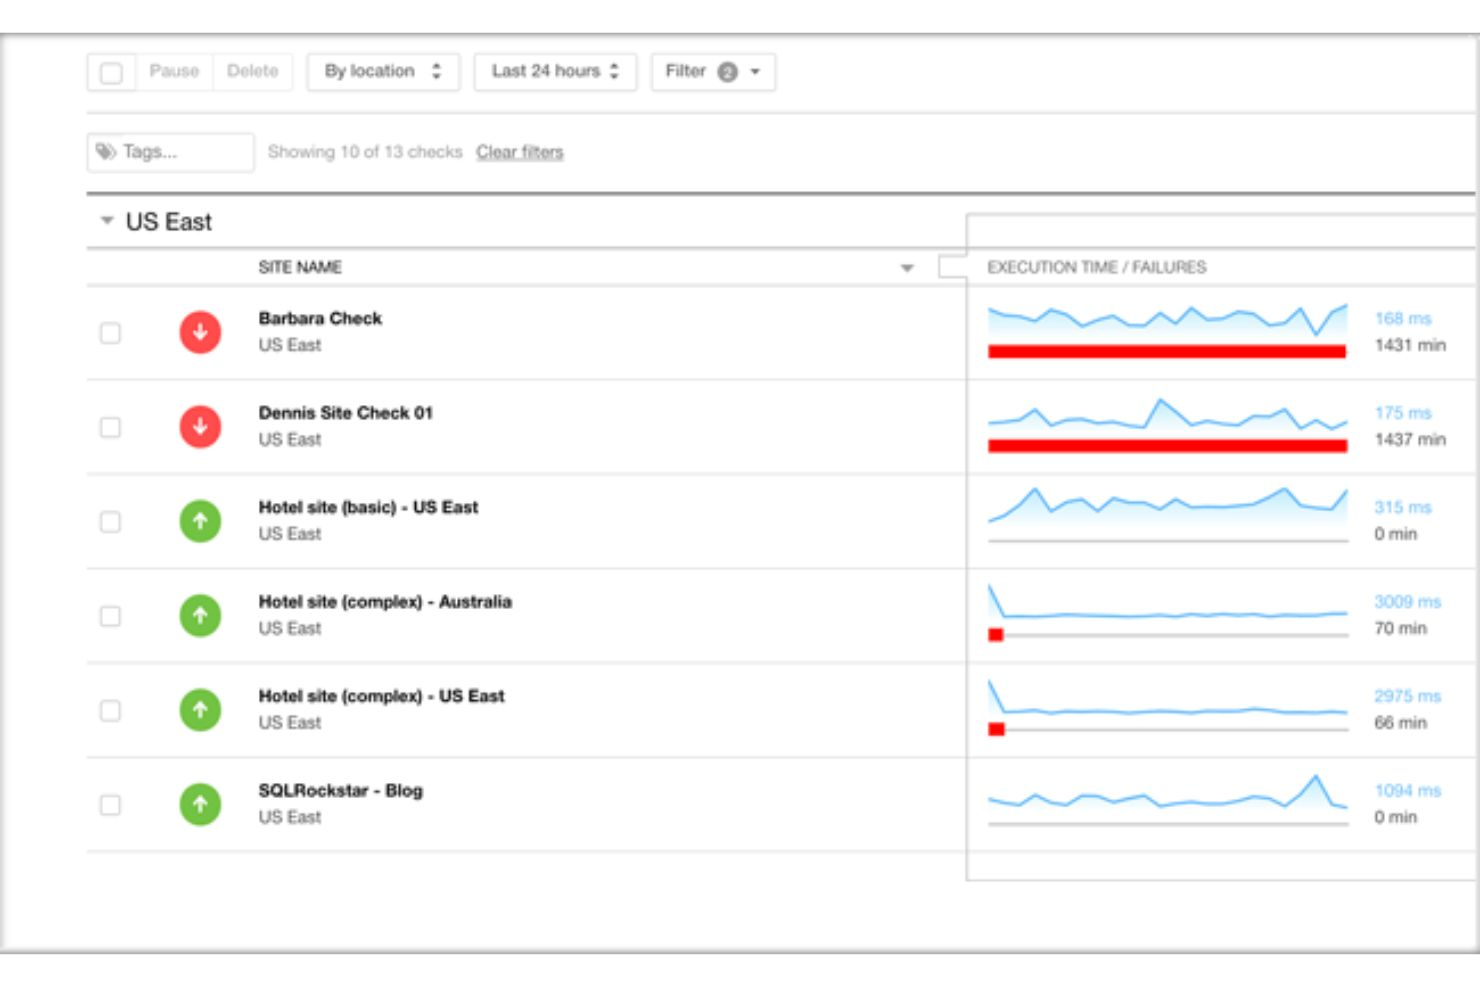
Pingdom helps you offer an exceptional user experience by providing real-time insight into your website's uptime and performance.
Why I picked Pingdom: Pingdom gives you access to fast and reliable outside-in monitoring capabilities you need to keep tabs on how your website is performing. It provides everything you need to test your website’s availability across countries, assess and optimize the loading speed of key pages, ensure frictionless site flows, and integrate with your favorite apps.
You get alerted through email or SMS as soon as your website becomes unavailable, a transaction fails, or something else happens.
Pingdom Standout Features and Integrations
Standout features: Pingdom helps you monitor webpage load times and provides detailed reports. With the reports, you can ascertain whether the slow loading speed is caused by the user’s device, network, or browser; or if your web components need to be optimized. The tool also has a developer-friendly API, which helps create new API queries within a short time with easy-to-use implementation.
Integrations include Slack, Rippling, Zapier, Pipefy, Grow, Klipfolio, Datadog, Office Chat, PagerDuty, and Talkspirit.
Pros and cons
Pros:
- Easy to get started
- Multiple monitoring features
- Friendly pricing
Cons:
- Reports can be complex to analyze
- Slow response from tech support

Zabbix, an open-source solution, provides a range of monitoring capabilities, including network, server, cloud, container, and database monitoring. It offers an all-in-one solution that helps you visualize or keep track of your whole IT infrastructure stack.
Why I picked Zabbix: This software stands out with business service monitoring. It helps you keep track of KPIs by providing visibility into your product’s performance. It comes with root cause analysis capability, which empowers you to detect where the problems lie so you can fix them quickly.
Zabbix uses automation solutions to offer high-performance problem detection in real-time. Its flexibility allows you to monitor whatever you want to ensure your customers’ user experience is optimal. When it comes to the security of your data, Zabbix lets you keep your sensitive information safe by saving it in an external vault.
Zabbix Standout Features and Integrations
Standout features include container monitoring and data visualization. Zabbix provides the capabilities to monitor your Kubernetes cluster and other cloud-based assets. You can keep an eye on the health of your pods, nodes, and other Kubernetes components. The data visualization feature provides additional insights and higher observability. This gives you access to beautifully displayed metrics and reports in various formats.
Integrations: Zabbix integrates with a wide range of tools, such as Datadog, PagerDuty, OpsGenie, xMatters, iLert, ClusterControl, ONEiO, Galileo, and OverOps.
Pros and cons
Pros:
- Available for free
- Highly secure
- Scalable
Cons:
- Limited customization
- More detailed tutorials or guides needed

Better Stack is a synthetic monitoring system that lets you prevent downtime and performance issues by providing visibility into your stack. It comes with the capabilities you need to debug issues and resolve incidents reliably.
Why I picked Better Stack: Better Stack helps you prevent downtime by providing synthetic monitoring capabilities, including uptime monitoring and log management. The tool lets you monitor, log, and troubleshoot anything. You can visualize your entire stack, categorize your logs neatly, and gain the clarity you need to debug issues and fix incidents quickly.
There are observability dashboards, which help you make sense of monitoring data from summarized metrics that are presented in beautifully designed dashboards. The tool monitors everything and provides actionable alerts that help you resolve issues faster. In addition, Better Stack allows your team members to collaborate effectively.
Better Stack Standout Features and Integrations
Standout features include incident management and status pages. Incident management capabilities provide you with all the debug data you need to resolve issues and collaborate with your team members. Status pages are designed to help you to keep your customers in the loop, enabling you to build trust and keep them informed. The pages are very customizable so you can use custom CSS to change the design to suit your product.
Integrations include MongoDB, Ubuntu, Apache2, Redis, Docker, Vector, Google Cloud, Heroku, Microsoft Azure, Datadog, and New Relic.
Pros and cons
Pros:
- Customizable features
- Resolve incidents faster
- Get started for free
Cons:
- There are some complex configurations
- Documentation needs more content

Upptime is an open-source uptime monitor and status page that is powered by GitHub. It helps you keep track of multiple web pages and provides actionable reports you need to run interventions accordingly.
Why I picked Upptime: It allows you to monitor uptime at short intervals — every 5 minutes. Powered by GitHub, you can keep track of unlimited web pages using GitHub Actions. Upptime notifies you as soon as any web page goes down and also saves version-controlled response time stats. With in-built alerting support for Slack, Telegram, and other communication tools, you enjoy the flexibility of selecting how you want to receive notifications.
Upptime Standout Features and Integrations
Standout features: Upptime offers a modern status page, which is a statically generated status website that displays your website’s live status, incident history, and response time graphs to users. The status page is customizable; you can add a logo and other branding elements to make it reflect your brand image.
Integrations include Slack, Telegram, Webhooks, Microsoft Teams, Gmail, Google Sheets, Discord, Trello, and Asana.
Pros and cons
Pros:
- It’s free and open-source
- Monitor unlimited web pages
- Reliable and scalable
Cons:
- Documentation needs more content
- Slow response from support

Checkly provides one monitoring as code workflow that lets you unite E2E testing and monitoring. This synthetic monitoring software allows you to code, test, and deploy monitoring at scale.
Why I picked Checkly: It provides reliable synthetic monitoring for important user journeys with Playwright. The tool helps you get rid of false positives and provides detailed insights to help you ensure your project is performing optimally. You can use the Playwright testing framework to test your apps and websites to ensure they are performing as expected.
Checkly stands out because it lets you monitor and test with real browsers. You can run checks in actual Chrome browsers, enabling you to perform synthetic tests with real-world conditions.
Checkly Standout Features and Integrations
Standout features: The software allows you to debug with ease by automatically assembling defects or bugs and presenting them in formats that enable fast debugging. Checkly provides performance reports on web vitals and load times for every page, giving you visibility into how your product is doing at every point in time.
Additionally, the tool boosts developer experience by letting users write their browser checks in TypeScript.
Integrations include GitHub, Webhooks, Slack, Pagerduty, OpsGenie, FireHydrant, Discord, Microsoft Teams, Telegram, and Splunk On-Call.
Pros and cons
Pros:
- It’s very user-friendly
- Seamless integrations
- Freemium version available
Cons:
- More customization required
- Lack of good documentation for reusing code snippets

Trusted by thousands of companies, including global brands like Pepsi, SkyWest, and Nokia, this platform helps you perform website uptime, website speed, real user, and transaction monitoring.
Why I picked Uptimia: I added this solution to my list because it makes monitoring the speed of user experience for your visitors very easy and reliable. It lets you simulate user behaviors and get detailed reports on loading speeds. You can track how your website is performing by country, browser, and operating system.
Uptimia Standout Features and Integrations
Standout features include website transaction monitoring. With Uptimia, you can reliably monitor shopping carts, login forms, check-out forms, and more. You get notified when something goes wrong with your transactions. The tool takes a step farther to let you know the root cause of the problem.
Integrations include Discord, Microsoft Teams, Slack, Telegram, Webhooks, and WhatsApp.
Pros and cons
Pros:
- Offers a free trial
- Good customer support
- Instant alerting
Cons:
- More reporting filters needed
- There is no free plan

UptimeRobot is a leading all-in-one, uptime monitoring solution. The software enables you to keep an eye on your assets or products everywhere you go. When something goes wrong, you get notified!
Why I picked UptimeRobot: I selected UptimeRobot because of its diverse synthetic monitoring capabilities. With this software, you can monitor all your digital assets in one place. It offers a range of monitoring solutions, including website, SSL, ping, port, cron job, and keyword monitoring.
UptimeRobot allows you to run multi-location checks. You can control or prevent false positives by verifying incidents from multiple locations. The tool lets you keep your team members and stakeholders in the know by inviting them to access your monitors and get notified about incidents.
UptimeRobot Standout Features and Integrations
Standout features: UptimeRobot enables you to share incident updates with your customers. You can send status updates through an email to customers that are subscribed to your Status page. The software provides white-labeled status pages, which you can customize to reflect your brand image.
Integrations: UptimeRobot has 10+ integrations, including Slack, Telegram, Webhooks, Discord, PagerDuty, Pushbullet, Microsoft Teams, Pushover, Google Chat, and Splunk On-Call.
Pros and cons
Pros:
- Friendly pricing
- Seamless integrations
- An all-in-one platform
Cons:
- Customer support response time needs to be improved
- Limited customization
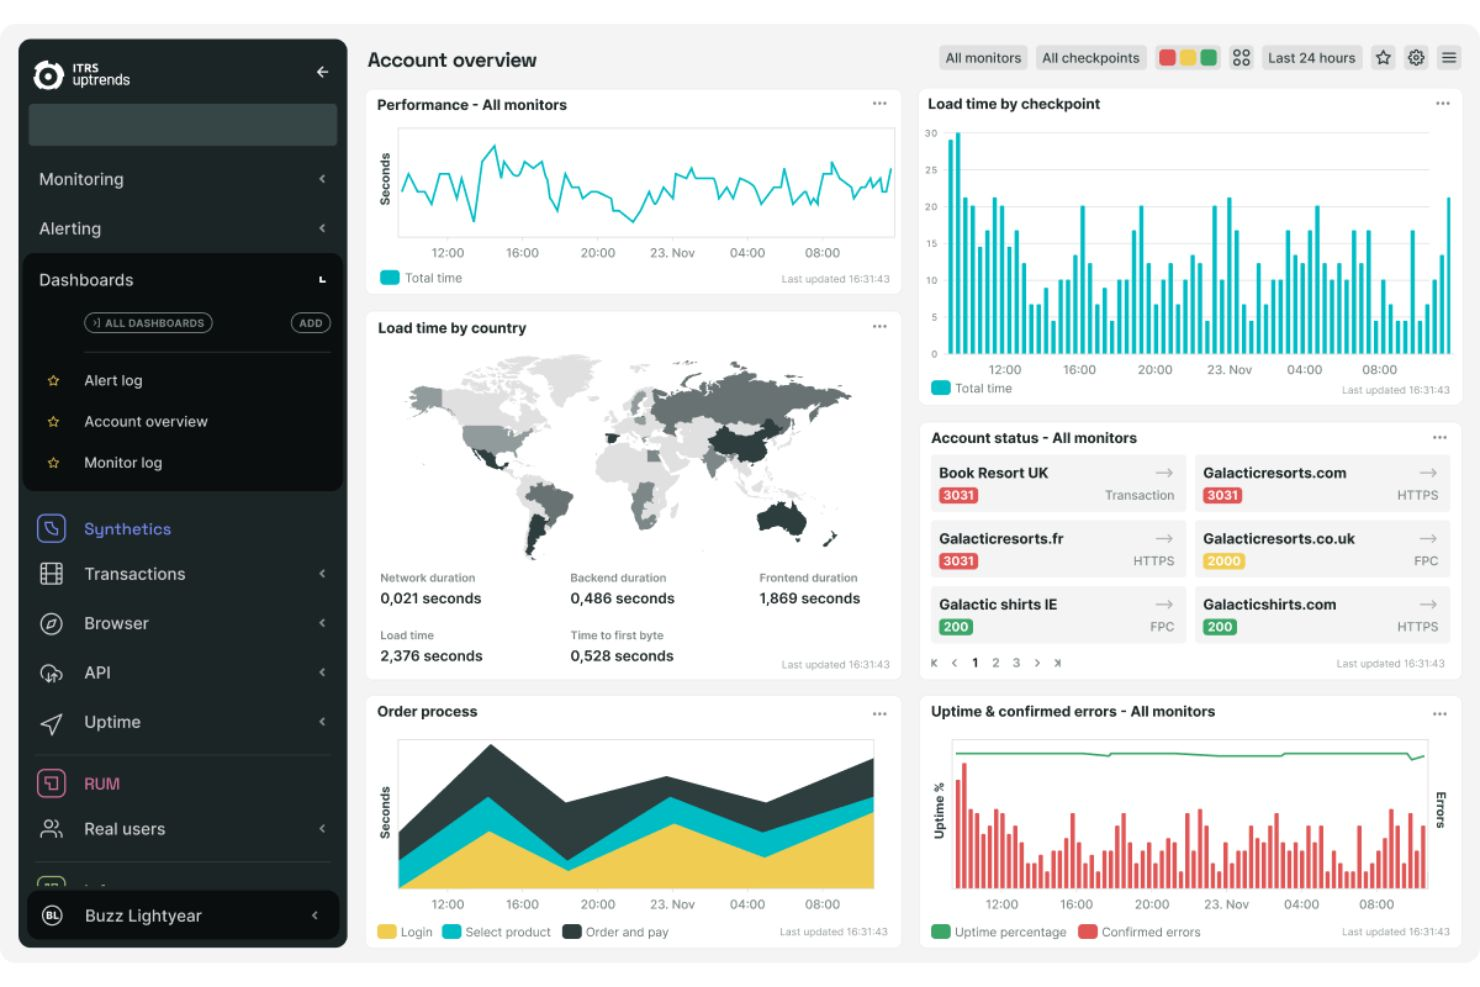
Uptrends offer synthetic monitoring solutions, including website monitoring, web application monitoring, and API monitoring. The software lets you test your website from up to 233 global locations.
Why I picked Uptrends: This tool helps you improve your web performance with its real browser web performance monitoring. It allows you to run website performance tests from 233 locations across the globe. Uptrends opens up a real browser from a location you have chosen and simulates user journeys on your websites exactly like a real user would use your website.
It provides detailed performance data, showing the root cause of issues and which element on your page caused the problem. Uptrends lets you see how your website performs on mobile devices. You can simulate user behavior on mobile devices using popular browsers.
Uptrends Standout Features and Integrations
Standout features include a Transaction Recorder, custom metrics, and concurrent monitoring. With Uptrends’ Transaction Recorder, you can record and keep an eye on shopping carts, payment providers, and opt-in forms. The custom metrics features allow you to track API metrics according to your needs. You can get custom data from API responses and get a good understanding of your total API performance.
Concurrent monitoring enables faster business transaction monitoring, infrastructure monitoring, troubleshooting, and problem resolution. This capability empowers you to perform a single check and get results from multiple locations.
Integrations include Slack, Microsoft Teams, PagerDuty, StatusHub, VictorOps, ServiceNow, StatusPage, AlertOps, Grafana, and Opsgenie.
Pros and cons
Pros:
- Real-time user insights and notifications
- Excellent customer support
- Good value for the cost
Cons:
- User management capabilities need improvement
- The UI needs to be more intuitive
The 10 Best Synthetic Monitoring Tools Summary
| Tools | Price | |
|---|---|---|
| ManageEngine Applications Manager | $395/year for monitoring up to 10 database servers | Website |
| Freshping | Free to use | Website |
| Pingdom | From $15/month | Website |
| Zabbix | Free to use | Website |
| Better Stack | From $30 per month | Website |
| Upptime | Free to use | Website |
| Checkly | From $30/month | Website |
| Uptimia | From $34/month | Website |
| UptimeRobot | From $8/month | Website |
| Uptrends | From $18.01/month | Website |
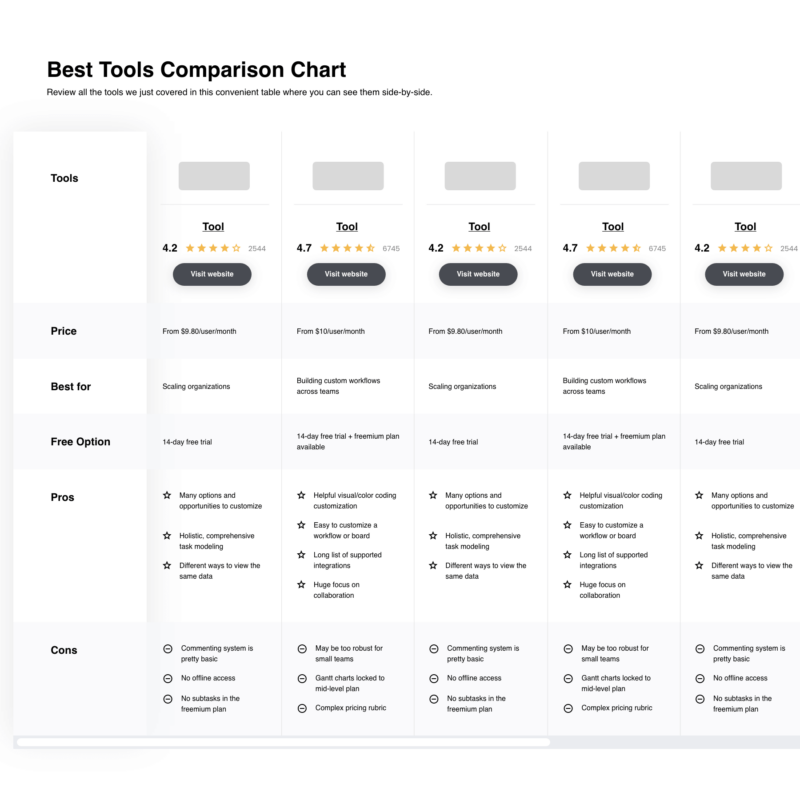
Compare Software Specs Side by Side
Use our comparison chart to review and evaluate software specs side-by-side.
Compare SoftwareOther Options
Here are a few more worthwhile options that didn’t make the best synthetic testing tools list:
- StatusCake
Best for page speed monitoring
- Prometheus
Best for supporting multiple languages
- New Relic
Best synthetic monitoring tool for streamlining collaboration
- Atatus
Best full-stack observability platform with real-time insights to diagnose and fix issues
- Site24x7
Best monitoring solution for DevOps and IT operations teams
- Opsgenie
Best synthetic testing solution for on-call and alert management
- PagerDuty
Best for automating and accelerating responses across your digital infrastructure
- Dotcom-Monitor
Best for monitoring APIs in real time
- Splunk
Best software for delivering unified security and end-to-end visibility
- Cachet
Best tool for creating and customizing status pages


Selection Criteria For Synthetic Monitoring Tools
Here’s a summary of the main selection and evaluation criteria I used to develop my list of the best synthetic monitoring tools for this article:
Core Functionality
The core functionalities I considered when I was evaluating synthetic testing tools for this article include:
- Smart alerting system
- Customizable workflow
- Various forms of monitoring
- Cloud, on-premise, or self-hosted options
- Monitoring across multiple environments
Key Features
I considered some key features before adding any tool to the list. All the solutions recommended above have the following major features (and more):
- Website monitoring: With this capability, you can keep track of your website’s maintenance with real-time visibility and alerts. The parameters that can be monitored include downtime, bandwidth consumption, bounce rate, and time spent on each page.
- Page speed monitoring: A capability that helps you monitor webpages to ensure they load as fast as expected. And when there is a page with a low loading speed, you will be notified according to your settings.
- Transaction monitoring: This enables you to monitor your website’s transactions. You can reliably monitor shopping carts, login forms, check-out forms, and more.
- SSL monitoring: SSL certificate monitoring keeps you in the know about your product’s security and notifies you about any SSL certificate issues.
- Container monitoring: Involvs the monitoring of your Kubernetes, while keeping tabs on the state of your pods, nodes, and other Kubernetes components.
- Server monitoring: This feature helps you monitor your servers and entire infrastructure for important performance metrics.
Usability
I picked tools that are easy to learn and use. The tools I recommended come with features that make the software very usable, including an intuitive user interface, detailed documentation, third-party tutorials, responsive customer support, and an active user community. Even though new software comes with a slight learning curve, your team will find the tools on my list very easy to get started with.
Software Integrations
Integrations allow you to connect your toolset with the synthetic monitoring system. This helps you to integrate the tool into your workflow without disrupting your processes. That said, I recommended tools that let you enhance their capabilities by integrating your favorite tools.
Pricing
When I was researching this article, I prioritized solutions with transparent and flexible pricing models. All the tools I picked have flexible pricing tiers, enabling you to settle for the tool and plan that suit your needs and budget.
People Also Ask
Here are some frequently asked questions:
What are the benefits of synthetic monitoring tools?
The benefits of synthetic monitoring software include finding and fixing issues early, baselining and benchmarking, tracking complex transactions and business processes, and maintaining user experience.
Who uses synthetic monitoring tools?
Software testers and quality assurance teams use synthetic monitoring solutions to monitor applications to ensure they are performing as expected. And if there are issues, they rely on synthetic test results to fix issues and optimize the product’s performance.
What are the 3 types of synthetic monitoring?
The three major types of synthetic monitoring are web performance monitoring, availability monitoring, and transaction monitoring.
Other Testing Tools
If you’re looking to learn more about software testing tools, check out the following reviews.
- Best QA Automation Tools for Software Testing
- Best Test Management Tools
- Best Performance Testing Software
- Best Open-Source Test Management Tools
- Best Test Case Management Software
Final Thoughts
Synthetic monitoring systems help you fix issues early. With the help of machine learning-powered automation, these tools enable you to spot flaws automatically, resolve issues quickly, and avoid user experience disruptions.
Deliver beyond your customers’ expectations with the help of one of the tools I recommended. Do you want to learn more about quality assurance? Sign up for The QA Lead newsletter to get the latest insights from top thinkers in the QA industry.