10 Best SQL Analytics Services Shortlist
Here's my pick of the 10 best software from the 15 tools reviewed.
Our one-on-one guidance will help you find the perfect fit.


With so many different SQL analytics tools available, figuring out which is right for you is tough. You know you want to query, manipulate, and analyze large volumes of data stored in relational databases but need to figure out which tool is best. I've got you! In this post I'll help make your choice easy, sharing my personal experiences using dozens of different SQL analytics software with various projects, with my picks of the best SQL analytics tools.
What Are SQL Analytics Tools?
SQL analytics tools are software that enable advanced data analysis using SQL (Structured Query Language) in relational databases. These tools provide functionalities for complex querying, data manipulation, and analysis, often incorporating features for data visualization, reporting, and real-time analytics. They are tailored for in-depth examination and interpretation of large datasets stored in SQL databases.
The benefits and uses of SQL analytics tools include enhanced capabilities for data analysis, enabling businesses to derive meaningful insights from their data. They facilitate informed decision-making by providing a deeper understanding of trends, patterns, and anomalies in data. With features like data visualization and real-time analysis, these tools make complex data more accessible and actionable. They are essential in fields like business intelligence, market research, and data science, where comprehensive data analysis is crucial.

Need expert help selecting the right tool?
With one-on-one help, we guide you to your top software options. Narrow down your software search & make a confident choice.
Overviews Of The 10 Best SQL Analytics Tools
This is a list of the best SQL analytics tools. I’ve highlighted each tool’s top features and use cases. I’ve also linked to the website so you can easily find out more.
Aqua Data Studio is a database IDE that allows you to run queries on most popular data sources. It also comes with plenty of big data management and visual analytics features. The IDE helps data scientists easily develop and run SQL queries. Results are shown in a filterable spreadsheet-like grid which makes them familiar for anyone who has used Excel.
A cool feature is a visual whiteboard. This lets those without advanced SQL code knowledge create queries using a visual drag and drop interface. The tool uses this information to generate a full SQL statement.
Aqua Data Studio pricing starts at $499 for a single user.
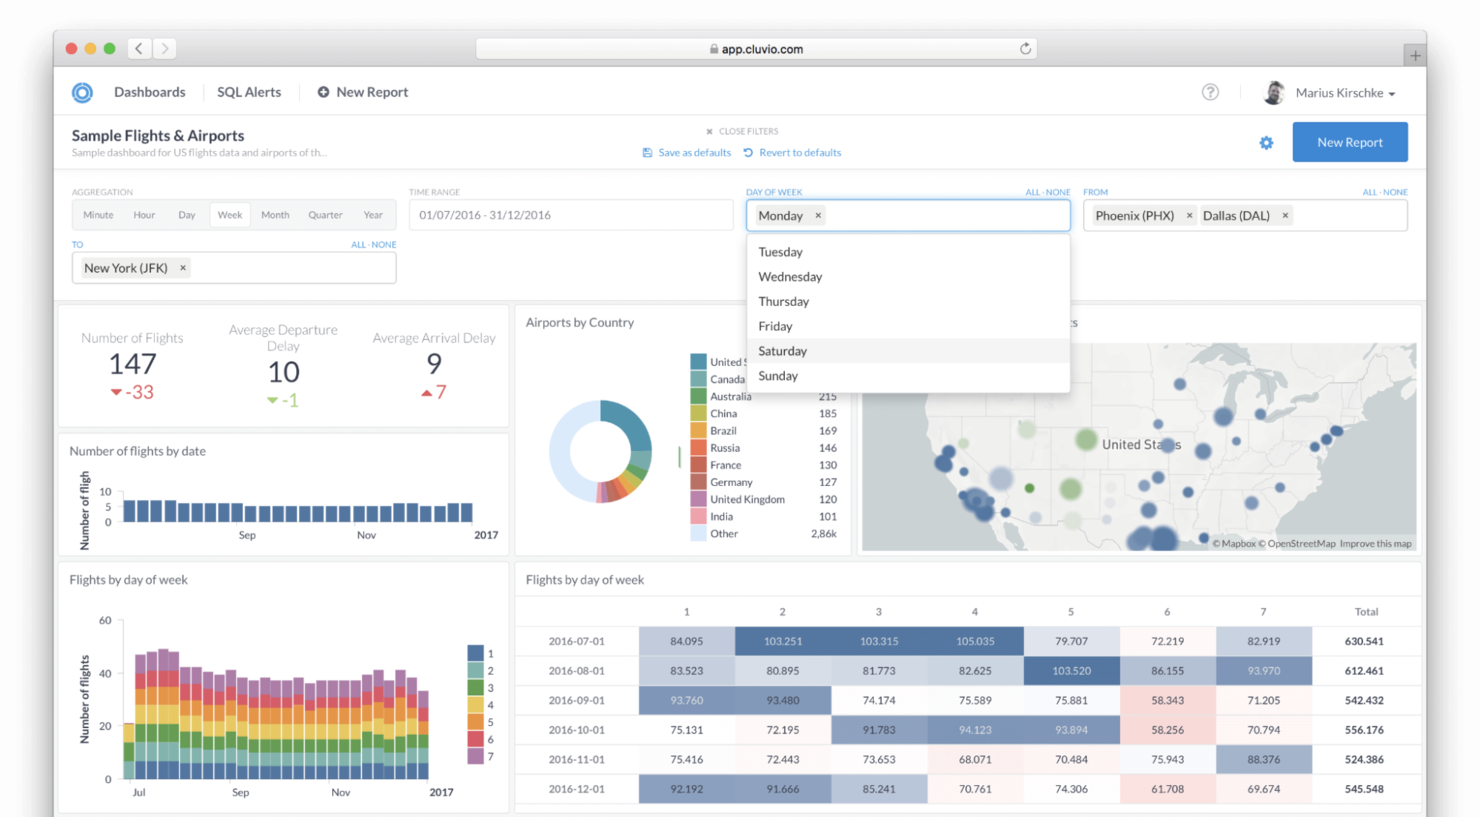
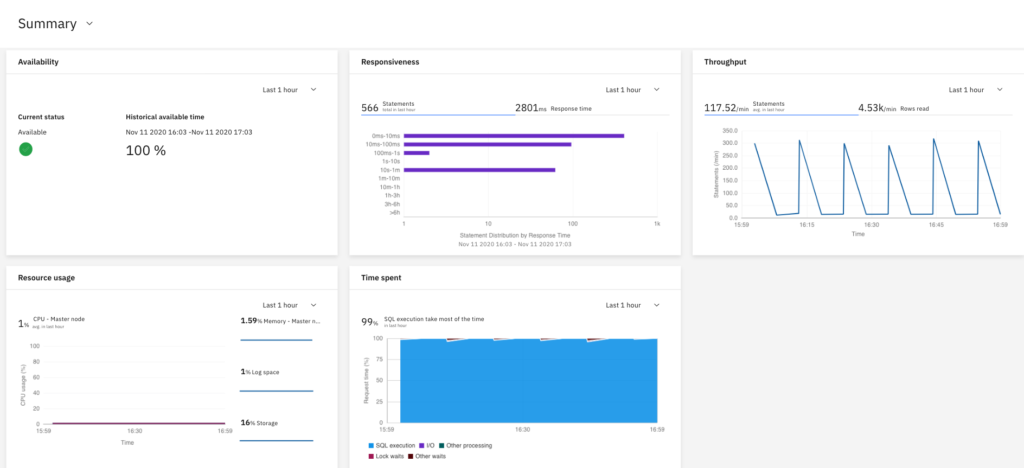
Cluvio is a cloud analytics platform that lets you analyze data in your existing databases and warehouses. You can then create and share interactive dashboards.
The process is satisfyingly simple. The tool works with most databases, including AWS, Oracle, Google Cloud, and Microsoft SQL Server. Just connect the data from inside the dashboard. You can then use the built-in SQL editor to create and run ad-hoc queries. This results in easy-to-read charts and dashboards that you can share with others in your organization.
Cluvio has a free plan for single users with limited dashboards and queries. Paid plans start at $279/month.
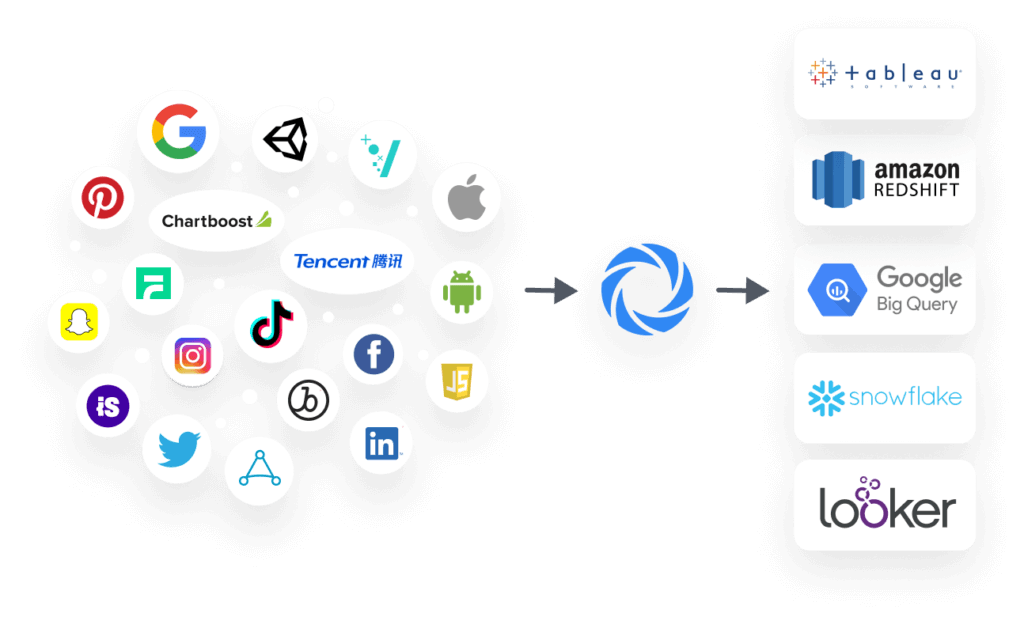
Singular is a data platform that makes it easy to pull in data from various marketing platforms and run queries. The software has ready-made integrations with all the leading marketing platforms, including Google Ads, Facebook, Linkedin, and many more. Import data from each platform to get an overall view of marketing activity.
You can see fields like ROI, conversions, and cost, which makes it easy to see how campaigns are performing across multiple platforms. The tool also comes with ready-made sample SQL queries so you can perform searches without knowledge of SQL.
Singular has a free plan that provides unlimited data connectors and seats. Paid plans offer more reporting and permissions. Contact the company for pricing.
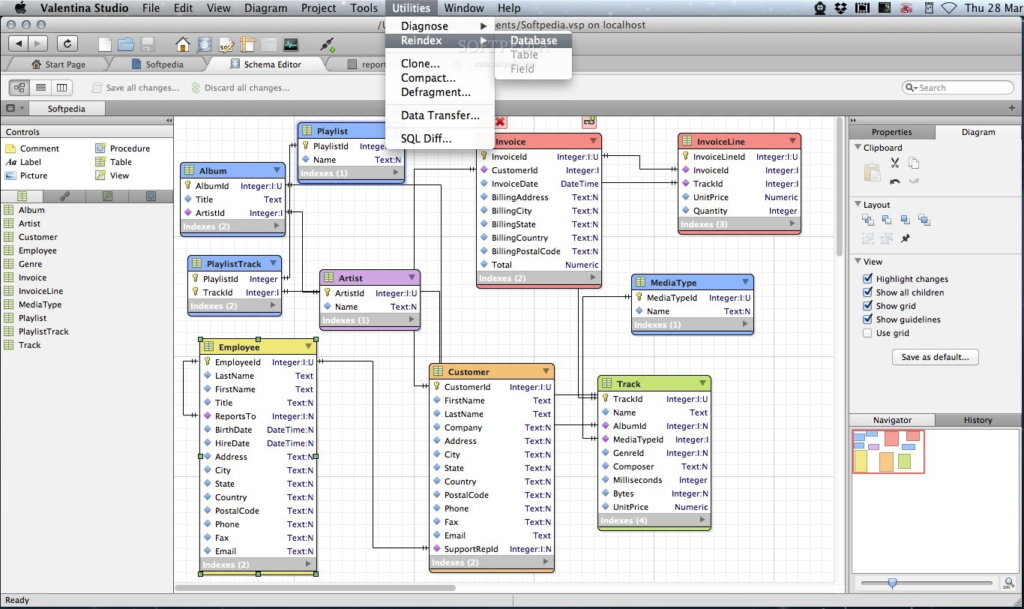
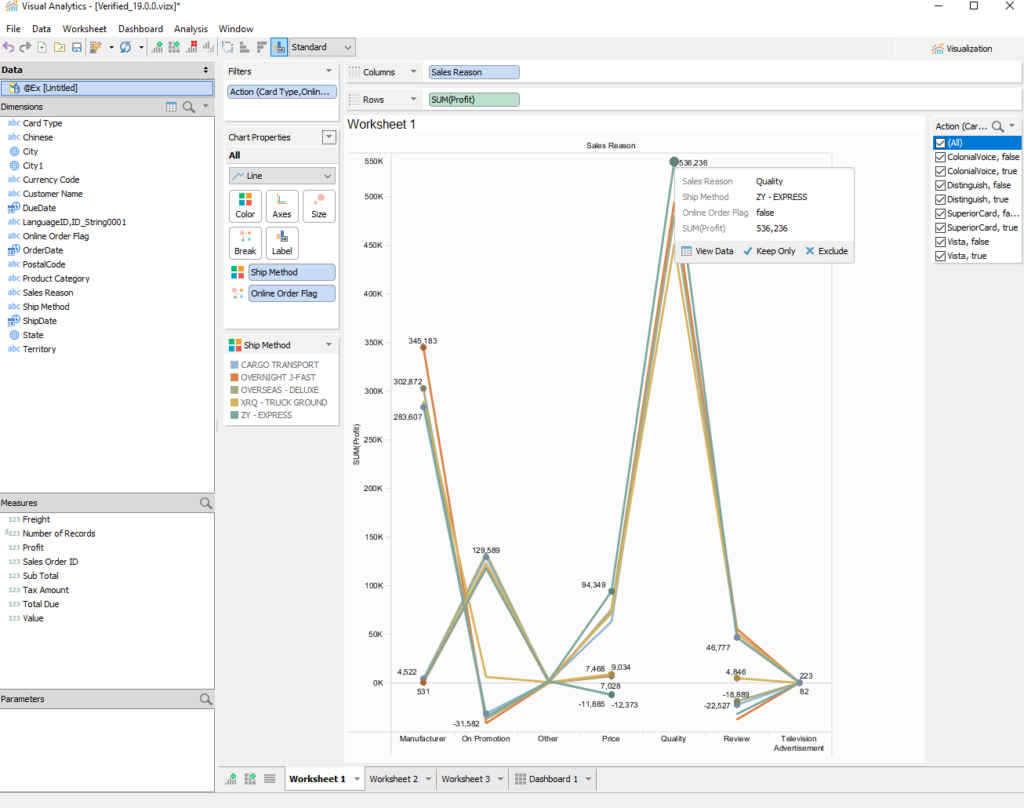
Valentina lets you create reports from either your existing database or its own object-relational system. It does this by combining an enterprise reports server with two database servers. Built-in encryption and SSL ensure that your data is secure. You can also see a real-time overview of database performance by watching live logs and running diagnostics.
The reports server lets you turn the data into visual reports. These can be exported as PDFs, web pages, images, or text reports. Whichever option you choose, it’s easy to share these reports with your team or people outside your organization.
The company offers a powerful free server. The paid option costs $1,499.95 per server and adds features like data modeling and report design.
IBM Db2 Big SQL is an enterprise-level analytics solution that uses an SQL-on-Hadoop engine. Running queries from within the platform is easy and there are even ready-made templates you can use. The tool also integrated with Apache Spark.
The tool stands out due to its powerful data management features. It allows you to integrate multiple data types. For example, you can combine new forms of unstructured data such as that from social media or video and audio streaming with traditional data. Companies with a lot of cold data taking up bandwidth can easily offload this to Hadoop.
You can buy versions of the tool either integrated with the Cloudera Data Platform or a cloud-native service. Contact the company for pricing.
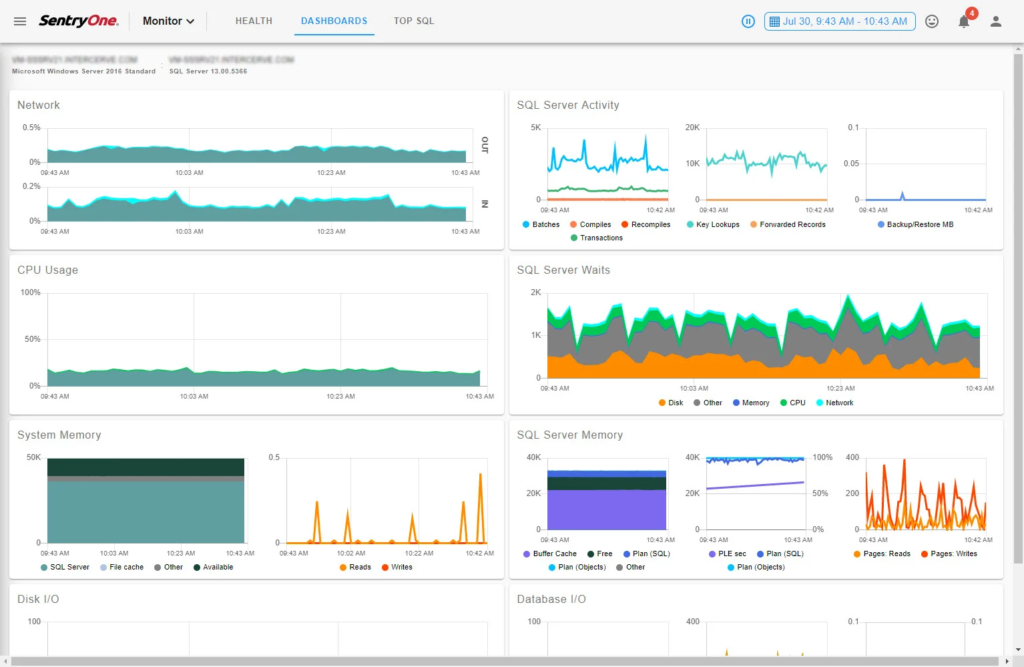
SQL Sentry is a database monitoring tool from SentryOne. It lets you optimize database performance by helping you monitor, diagnose, and fix database issues. The performance analysis dashboard shows an overview of server activity. If you want to look at a particular aspect, you can dig deeper into the data from here.
The top SQL view is useful. It highlights the top 20% of resource-intensive database queries. You and your team can then focus on tuning these queries to improve database performance. Sharing performance data is easy too. Create reports in a web browser and then share them with people in your organization.
SQL Sentry doesn’t advertise pricing. But you can head to the website to request a quote.
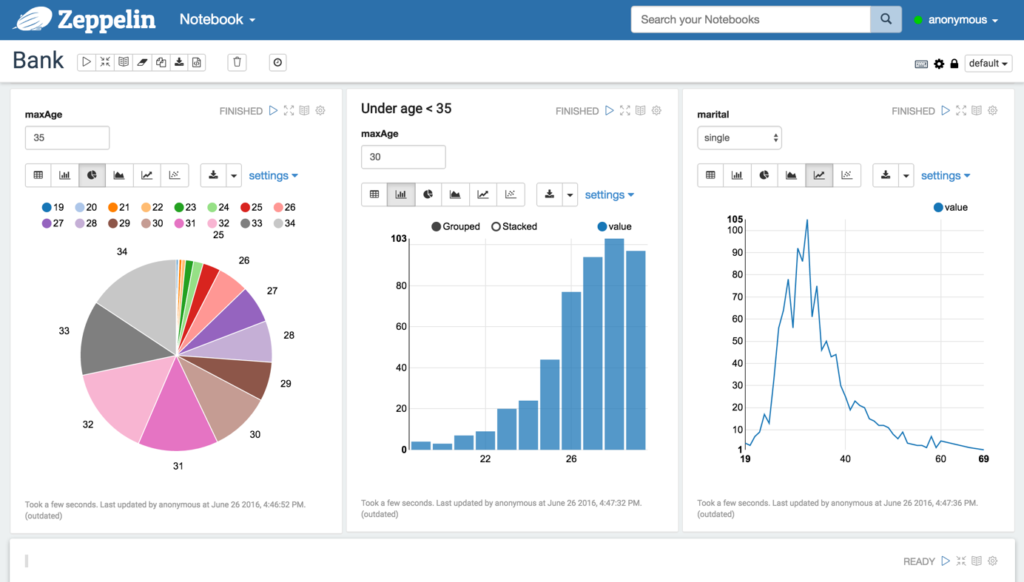
Apache Zeppelin is a web-based notebook that lets you plug in data from various sources for analysis. QA analysts can then run queries and create visualizations based on the results.
Once the report is finalized, you can share the URL with relevant parties. You can even embed the results in a web page using an iframe. And if you need to change an aspect of the report you can do so—all adjustments are reflected in real-time.
A huge benefit to using Apache Zeppelin is that it is open-source and free to download and use.
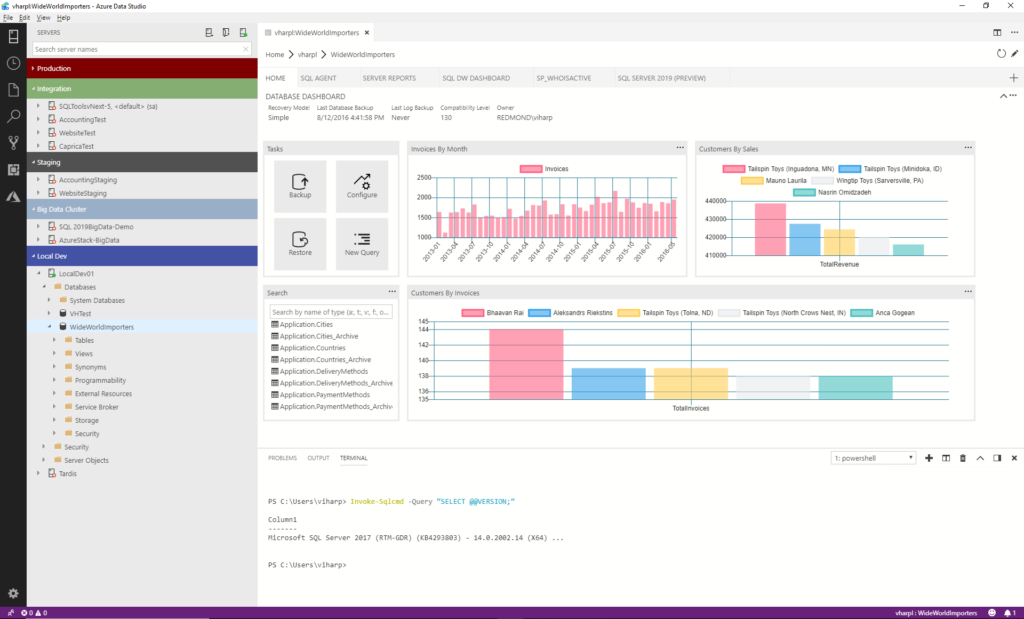
Microsoft SQL Server is an advanced data management platform. It connects with external applications and business intelligence tools while offering built-in intelligence functionality.
The SQL server works with Azure Data Studio to make accessing data insight easy. It has a rich SQL editor that lets you run queries and quickly visualize results with charts. You can also use SQL Server Management studio for more complex administrative tasks.
The company offers several versions of SQL Server. These include free versions for small businesses with up to 10GBs of storage and paid standard and enterprise editions.
Best for embedding self-service analytics into your web application
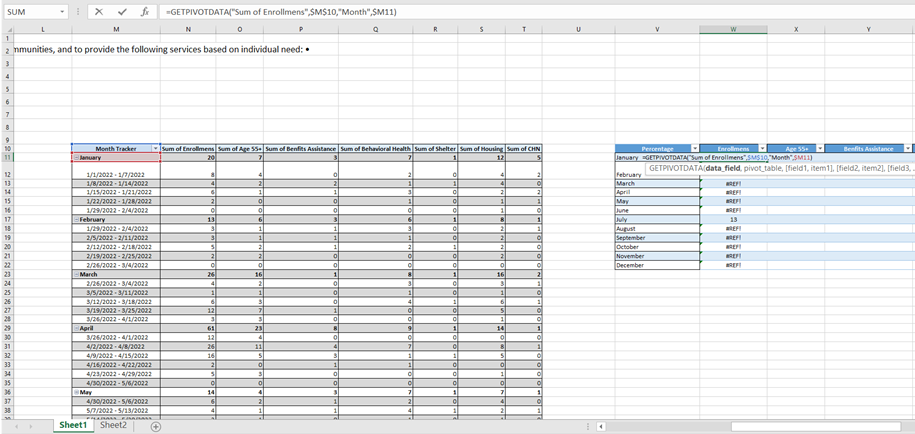
PivotData REST Service is a SQL analytics solution that provides web pivot tables for all your acquired databases. The tool allows you to store multiple values in one table, as well as sort your tables by values, totals or labels. PivotData REST Service also provides server-side pagination for larger pivot tables. PivotData REST Service provides dashboard software where you and your team are able to create and manage your key performance indicators, as well as performance metrics. The tool also provides strategic planning software so you and your team can collaborate on the analysis of your databases. Lastly, PivotData REST Service allows you to export your user-defined reports through PDF, CSV, HTML and JSON. PivotData REST Service provides integration with frameworks such as ASP.NET, Java, PHP and Ruby. The cost of PivotData REST Service starts at $499/per year for a 1-Server Licence. The tool also offers a trial pack.
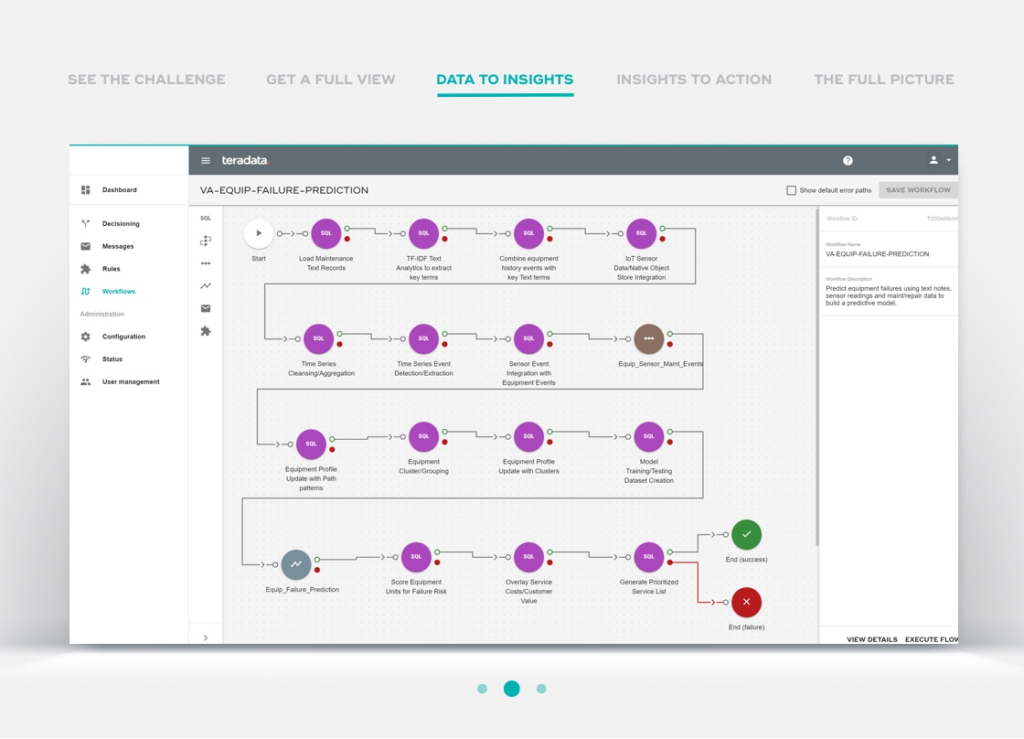
One feature I like is how Teradata Vantage Advanced SQL Engine helps you get fast answers. It does this by breaking down complex analytics workloads and distributing them for more efficient performance.
The software has plenty of features. 4D analytics is particularly powerful—it combines geospatial location metrics with time-series data, which is especially useful for gaining insight into technology like IoT smart devices.
The amount you pay for Teradata Vantage depends on your usage and your cloud server. Pricing starts at $3 per vantage unit on AWS.
The Best SQL Analytics Tools Summary
| Tools | Price | |
|---|---|---|
| Aqua Data Studio | $499 for a single user | Website |
| Cluvio | From $249/month | Website |
| Singular | No price details | Website |
| Valentina | $79.99 each | Website |
| IBM Db2 Big SQL | No price details | Website |
| SQL Sentry | No price details | Website |
| Apache Zeppelin | No price details | Website |
| Microsoft SQL Server | Pricing upon request | Website |
| PivotData REST Service | No price details | Website |
| Teradata Vantage Advanced SQL Engine | $3 per vantage unit on AWS | Website |
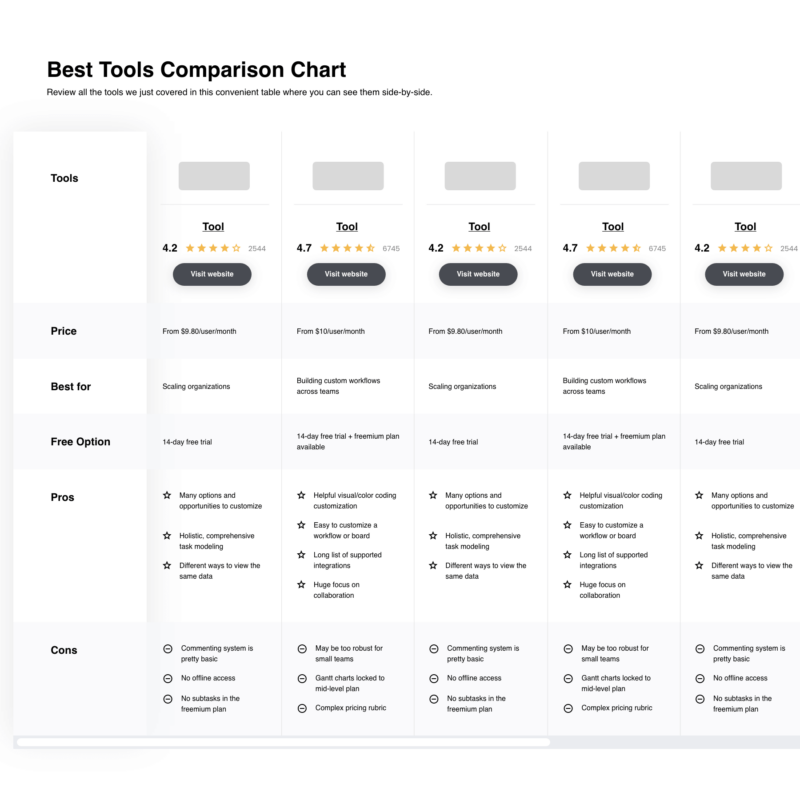
Compare Software Specs Side by Side
Use our comparison chart to review and evaluate software specs side-by-side.
Compare SoftwareOther Options for SQL Analytics
I think the above SQL analytics tools are the best options for most people. But, there are still plenty of other great tools on the market that may be better suited to your needs.
-
Databricks SQL Analytics
Best for unifying data management
-
Pecan
Best SQL analytics for predictive customer & sales data
-
Database Manager by Nucleon Software
Best for a wide variety of data source support
-
SQLite
Best for local data storage for individual applications
-
SQL Diagnostic Manager
Best for database diagnostics


Here’s How I Chose These SQL Analytics Tools
Here’s a summary of the evaluation criteria I used to select the tools on this list. These are the features that make the tools stand out in a crowded market.
- User Interface (UI): A good UI compliments powerful features by making the software a pleasure to interact with.
- Usability: Despite the complexity of the language, SQL tools can be surprisingly beginner-friendly due to features like built-in code samples.
- Integrations: Analytics tools are only as good as the data you feed them. All the tools on this list integrate with a wide variety of data sources. Choose a service that integrates with the SQL databases and datasets you currently use.
- Value for $: This list includes everything from free open source SQL tools, to costly solutions designed to power enterprises. While prices vary vastly, we think each one offers good value for money.
SQL Analytics Features to Look Out For
Most SQL analytics tools have some functionality in common. Here are some of the main features to look out for.
- Data visualization: It’s no use having data if the people you share it with can’t understand what it says. The best SQL analytics tools make creating powerful data visualizations easy.
- Report sharing: It should also be easy to share your findings with people inside and outside your organization. Look for the ability to create online reports you can update in real-time.
- Data management: SQL analytics tools have data management features. They will automatically organize data from different sources.
- SQL Samples: Not everyone in all QA teams is fluent in SQL. If this is the case in your team, look for tools with sample queries or the ability to save templates.
Can SQL be used for data analytics?
Put simply, yes. SQL lets you query, manage, update, and reorganize large amounts of data. This provides useful insights you can use to make better business decisions.
What are some SQL server analytic functions?
SQL server functions are code snippets that you can execute on an SQL server. Analytic functions calculate an aggregate value based on a group of rows. SQL analytics functions include:
CUME_DIST: Calculates the cumulative distribution of a row.
PERCENTILE_CONT: Calculates the value of a group of data a specific percentile.
LAST_VALUE: Shows the last value in a list of values.
What Do You Think About These SQL Analytics Tools and Services?
SQL analytics tools are a great way to gain insight from large amounts of data. But while useful, choosing the right one can be overwhelming. That’s because there are many different tools on the market, and many have similar features.
This article aimed to make things a little easier. Hopefully, it has helped you start your search for the right software. To get more helpful articles about QA, sign up for our newsletter, where we share our latest insights. Subscribe by clicking here.
Related List of Tools:
Also Worth Checking Out: